Welcome to the 16th installment of our Washington Capitals weekly trends report. The regular feature provides a very brief snapshot of the most relevant statistical trends for the Capitals over the past seven, and in this case, 10 days.
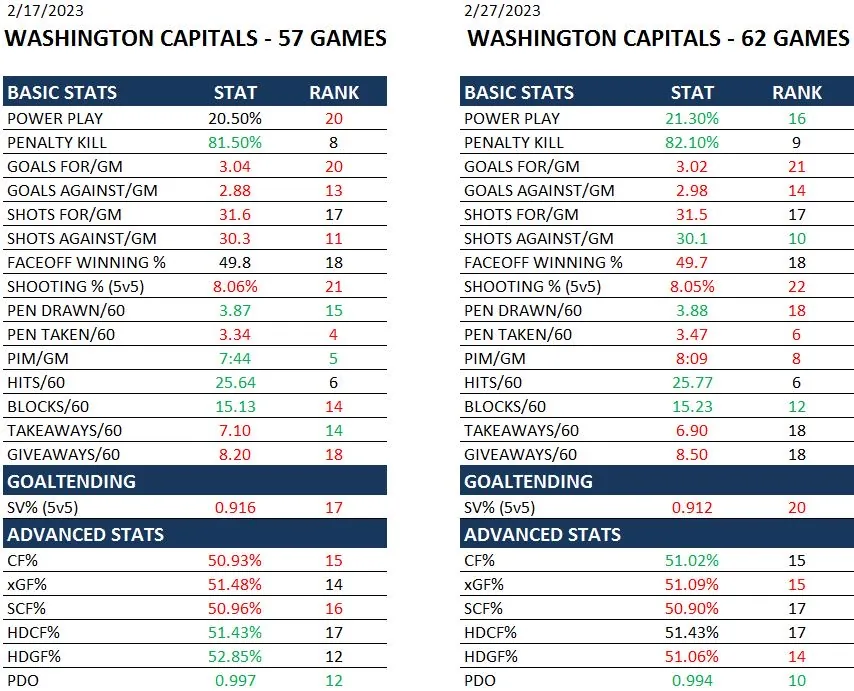
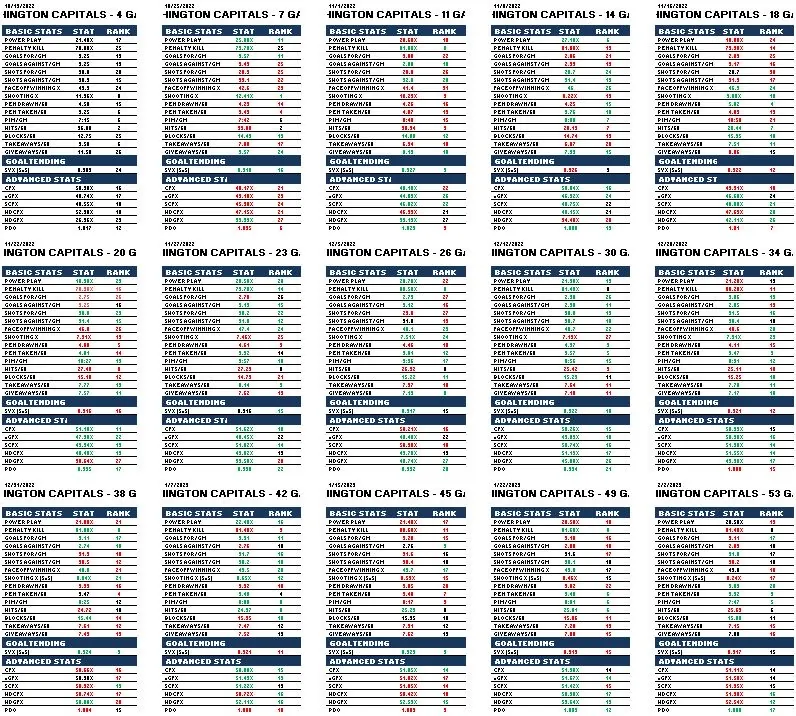
The following table lists the Capitals team stats and league rankings for last week (left side) after 57 games, and the current stats and rankings for today, after 62 games. The colors indicate improving (green) and/or worsening (red) trends over the past week. [Click to enlarge]
[The statistics used in this post are courtesy of Natural Stat Trick, MoneyPuck and the NoVa Caps Advanced Analytics Model (NCAAM). If you’d like to learn more about the statistical terms used in this post, please check out our NHL Analytics Glossary]
THE WEEK
The Capitals began this week’s snapshot with an underwhelming 4-1 defeat to the Carolina Hurricanes in the Stadium Series Game last Saturday. They then returned home for a 3-1 loss to the Red Wings on Tuesday and a 4-2 loss to the Ducks on Thursday. The Capitals rounded out the snapshot with an impressive 6-3 drubbing of the New York Rangers at Capitals One Arena on Saturday and a 7-4 loss to the Sabres in Buffalo on Sunday.
NEGATIVES
Goals For/Against – Another down week in the goals for and against department. Even though the goals for were buoyed by 10 goals over the weekend, the Capitals also gave up 10 goals.
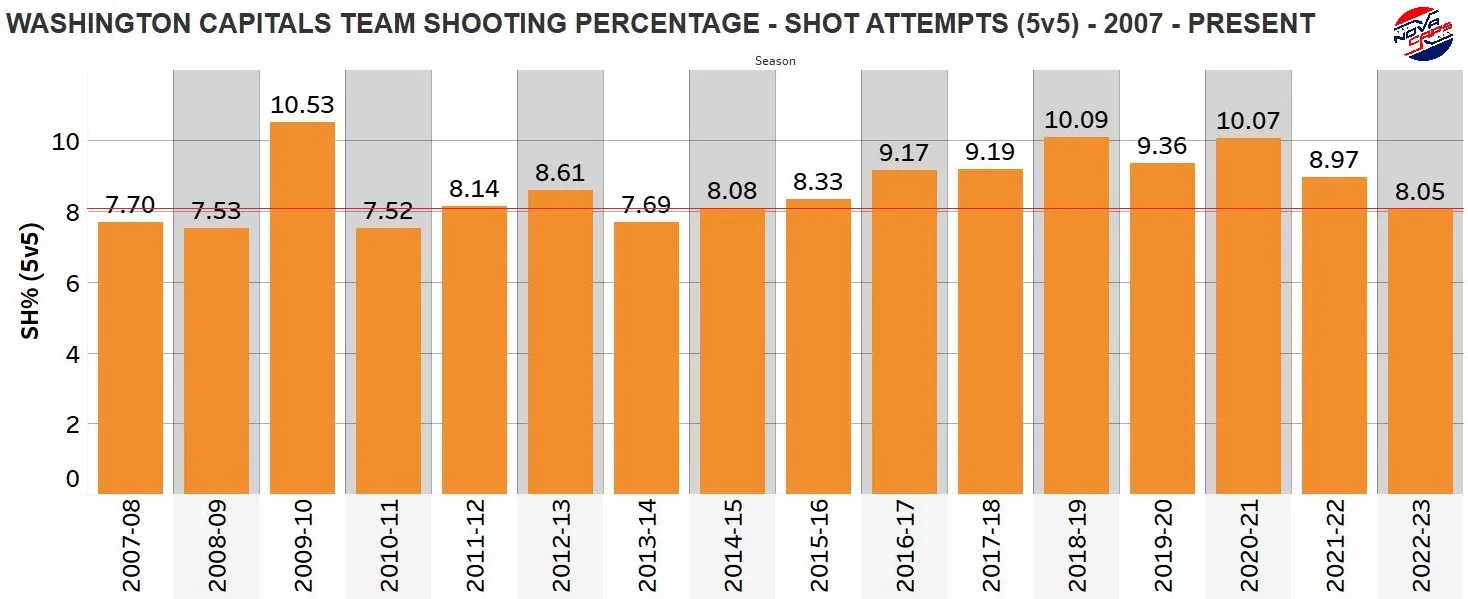
Shooting Percentage – The Capitals team shooting percentage dropped to a very poor 7.77% percentage before the weekend games, which was 25th in the league. They rebounded a bit over the weekend and currently have a team shooting percentage of 8.05%, which is now 22nd in the league. That’s still the lowest team shooting percentage since the 2013-14 season. The trend has also been steadily declining since the 2020-21 season.
Turnovers – The Capitals turnovers (for and against) continue to trend in the negative directions. The team is now 18th in the league in both categories.
POSITIVES
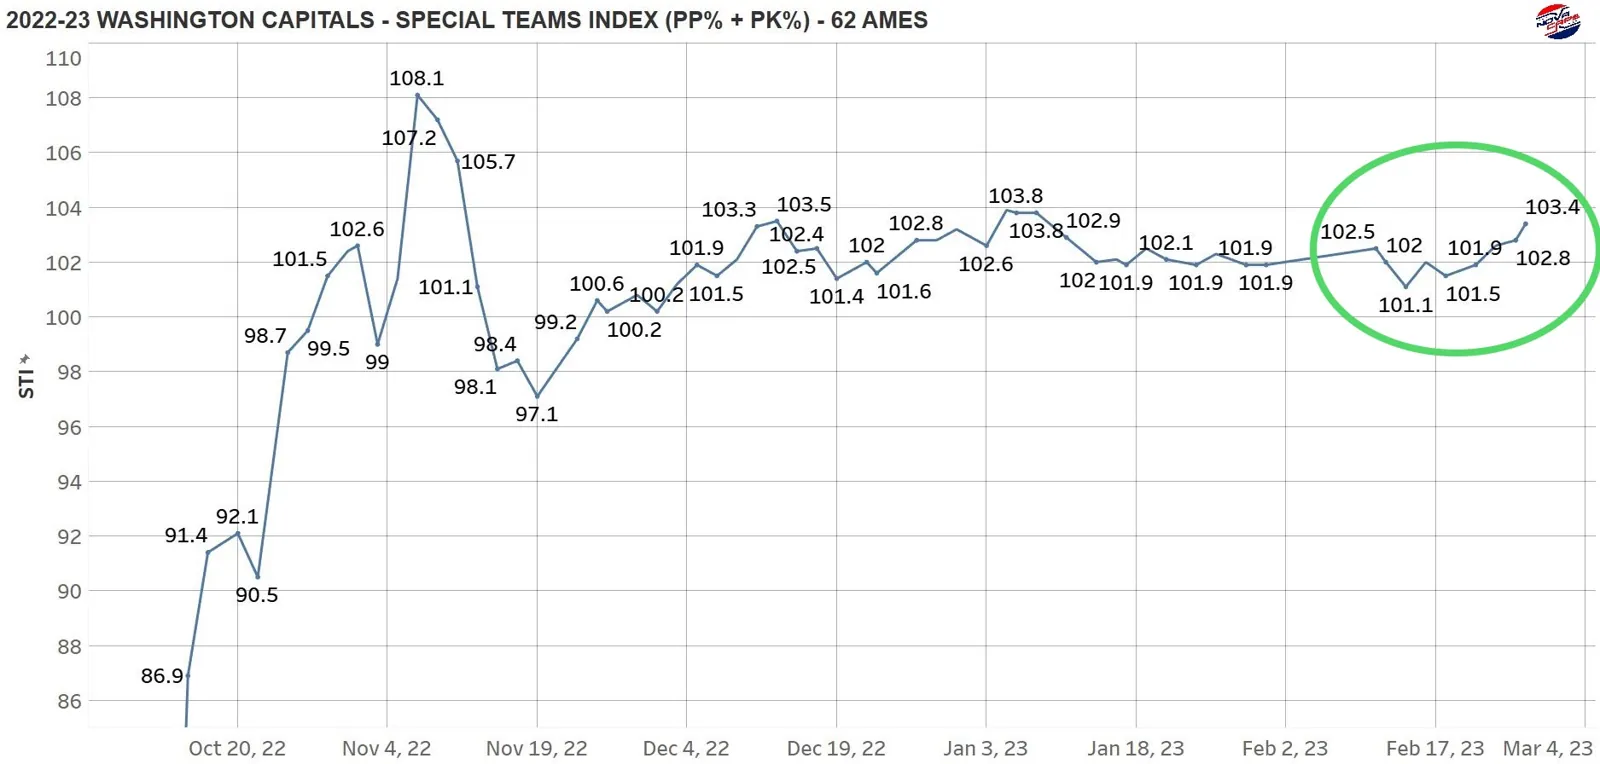
Special Teams – The Capitals power play and penalty kill both (quietly) improved over the last four games. In fact, the Capitals special teams index (PP% + PK%) currently sits at 103.4. That’s the highest it’s been since January 6 (103.8) and the second highest overall index for the season. [Click to enlarge].
THE WEEK AHEAD
The Capitals now head west for a relatively quiet week (three games) beginning with a rematch against the Ducks in Anaheim on Wednesday. They round-out their west coast trip with a visit to the Shark Tank on Saturday and a tilt with the Kings in Los Angelas next Monday.
By Jon Sorensen
SEASON TOTALS
By Jon Sorensen